What’s the best way to track metrics and outcomes that aren’t included in standard reporting? For many CX leaders, the answer often lies outside their dashboards—working with BI teams, waiting on custom reports, or stitching together data across systems. That delay can make it hard to understand what’s really driving changes in the business, whether it’s a spike in refund requests, a surge in demo bookings, or a marketing campaign that suddenly takes off.
Custom Insights closes that gap by letting you define and track the KPIs unique to your business, helping you measure every customer moment. From CX outcomes like escalations or resolution reasons, to Sales and Marketing metrics like conversions or upgrades, Custom Insights helps every team make faster, data-backed decisions based on the same shared story.
Understanding metrics that matter
Traditional metrics like ticket volume, resolution time, and CSAT are important, but they don’t tell the full customer journey. Custom Insights solves this problem by giving CX leaders a flexible way to define and track the outcomes that matter most to their business.
Custom Insights enables you to define custom events within your workflows, tailored to the specific business outcomes you aim to measure. Each time that step runs, the event automatically fires. You can enrich the event with properties that describe it, so you can later break down the numbers and see exactly what’s driving the trend. Those events and properties then feed into insight cards, which are visual reports that sit on your dashboards, where you can track totals, build funnels, or calculate sums and averages in real time.
The combination of these features provides real-time visibility into what drives business outcomes, allowing you to act on them immediately.
Custom Insights makes every AI Agent measurable and accountable to outcomes
The strength of Custom Insights lies in its flexibility. Every business defines success differently, and until now, analytics tools have forced leaders into a narrow set of default metrics.
With Custom Insights, your dashboards adapt to your priorities. You decide which outcomes matter and you track them in real time. By turning every AI Agent into a measurable driver of business results, Custom Insights makes it possible to see exactly how CX impacts your bottom line.
1. Create and fire custom events
They’re the step-by-step sequences that resolve customer issues from start to finish. A refund agent for example, might check eligibility, process the refund, and notify the customer.
Traditional events capture the milestones in those workflows, such as when a ticket is created, escalated, or closed. Many leaders depend on these metrics to track volume and resolution rates. Custom events build on that foundation. They let you define the moments that explain why business outcomes are shifting.
Imagine you’ve just launched a new product line at a retail outlet, and in the next leadership meeting, you’re asked why revenue dipped. The traditional events on your dashboards show that tickets are up and CSAT is trending down. That’s useful, but it doesn’t tell you the root cause.
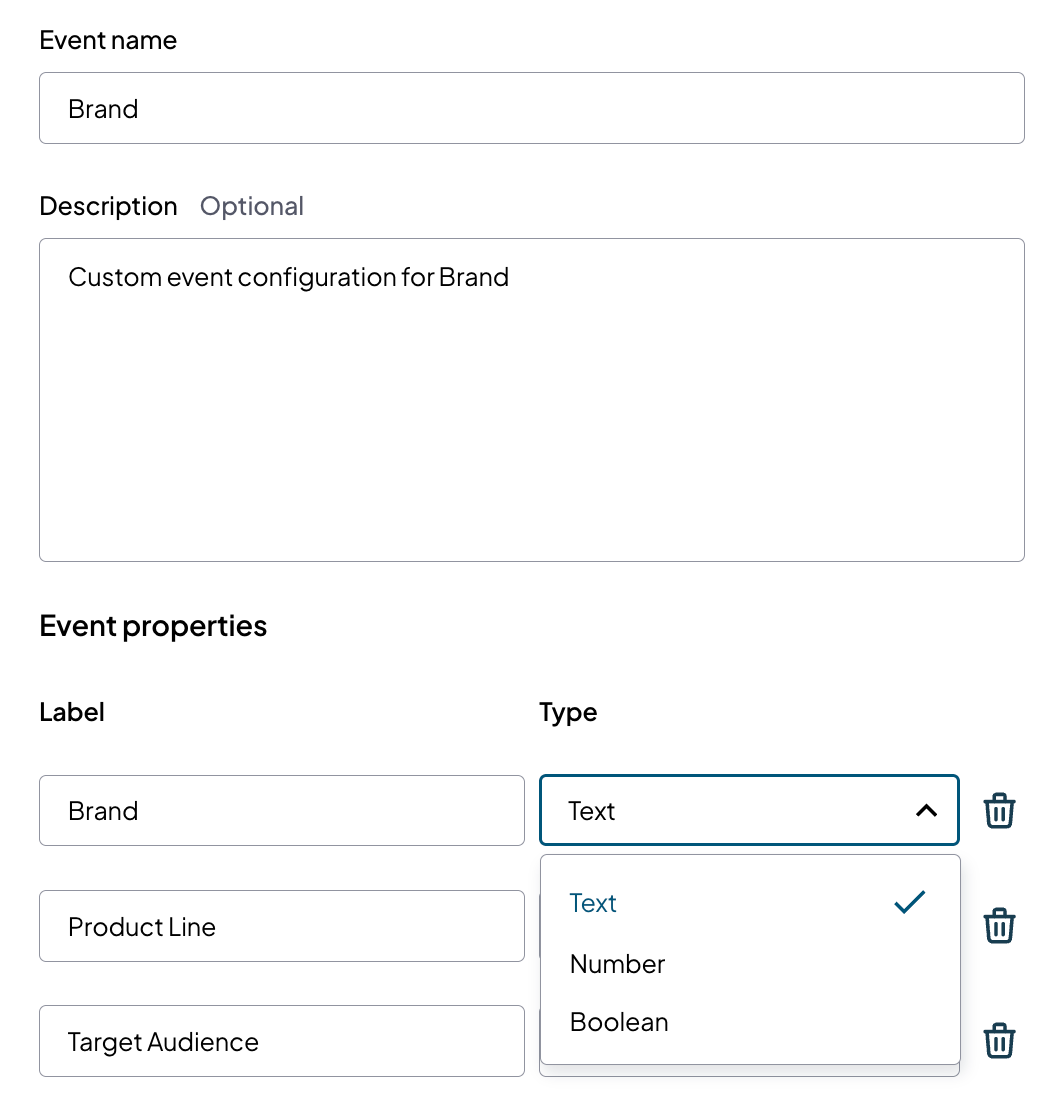
With Custom Insights, you can drop custom events into the refund agent In this case, you might choose to create events like refund_requested, refund_processed, or even refund_amount. You can enrich those events with properties that make them more meaningful, like refund reasons, product lines, channels, or event customer tiers. For example
- Refund reasons might be: sizing_issue, damaged_item, or wrong_shipment
- Product lines might be: new_launch, or legacy
- Channels might be: chat, email, or voice
- Customer tier might be: new or loyal
Each time the custom event fires when a step is reached in a conversation, the event triggers automatically and sends its data into Custom Insights.
Now, instead of guessing, you might see that refund requests doubled, 70% were tied to the new launch, and most cited sizing issues from chat. That level of clarity changes the conversation. You leave the meeting knowing where to focus and how to fix it.
Once that data is flowing, you can pair your traditional metrics with custom events inside an insight card, so instead of seeing numbers in isolation, you get a clear view of what’s really driving the trend.
2. Build insight cards that visualize results in real-time
Once your custom events are firing, the next step is to turn that data into actionable insights. An insight card is a visual report you create using your events and properties. It takes the raw stream of events and transforms it into a chart, number, or funnel you can scan in seconds.
Think back to the refund example. You’ve created events for refund_requested, refund_processed, and attached a numeric property for refund_amount. To understand the revenue impact, consider building a card that summarizes the refund_amount and breaks it down by properties such as sizing_issue, damaged_item, or wrong_shipment. The result might show that while sizing issues created the highest number of refund requests, damaged items in the new product line were responsible for the biggest share of refunded revenue.
Instead of treating all refunds the same, you can now identify which problems are most detrimental to your business and adjust course immediately. Perhaps your traditional events indicate that most tickets were opened due to a sizing issue. Digging deeper, you realize there’s a typo in the sizing chart on your website. That matters, and it needs to be fixed.
But Custom Insights lets you look at the same picture from a different angle. When you chart refund_amount and break it down by refund reason, you see that in the new launch, the largest share of refunded revenue came from damaged items. Entire orders were being sent back because of a packaging problem, even though there were fewer tickets overall.
Without Custom Insights, you might have stopped at the ticket count and focused only on sizing. With it, you see the packaging issue was costing you more revenue than sizing, and you know exactly where to act. Plus, because you’re also tracking refund_requested and refund_processed as events, you can look at the same data by ticket volume or conversion funnel to see the full picture.
Turn customer interactions into business clarity
The point of Custom Insights isn’t to drown you in more data. It’s about turning what customers tell you every day into the proof points your business needs to act. Instead of fighting to explain why a metric moved, you can show exactly which issues are driving revenue losses or gains, where processes are breaking down, and what changes will reverse the trend.
That clarity puts you in the driver’s seat, not just as the advocate for customers’ voice, but as the leader who ties their voices directly to business performance.
Hashtags blocks for sticky navbar (visible only for admin)
{{resource-cta}}
{{resource-cta-horizontal}}
{{authors-one-in-row}}

{{authors-two-in-row}}
{{download-the-report}}
{{cs-card}}